Last Updated on May 13, 2014 by Tim
Those graphs, those hideous-hideous graphs! Open up the majority of the brochures, reports or memos from enterprises and undoubtedly you’ll be thinking the same thing. Unless a company is going to invest in a creative department or pay the large fees to use a third-party agency to spice things up, the product will more than likely leave the readers free-of-excitement. But the truth is “design-driven companies outperformed other companies in the S&P 500 by 228%”.
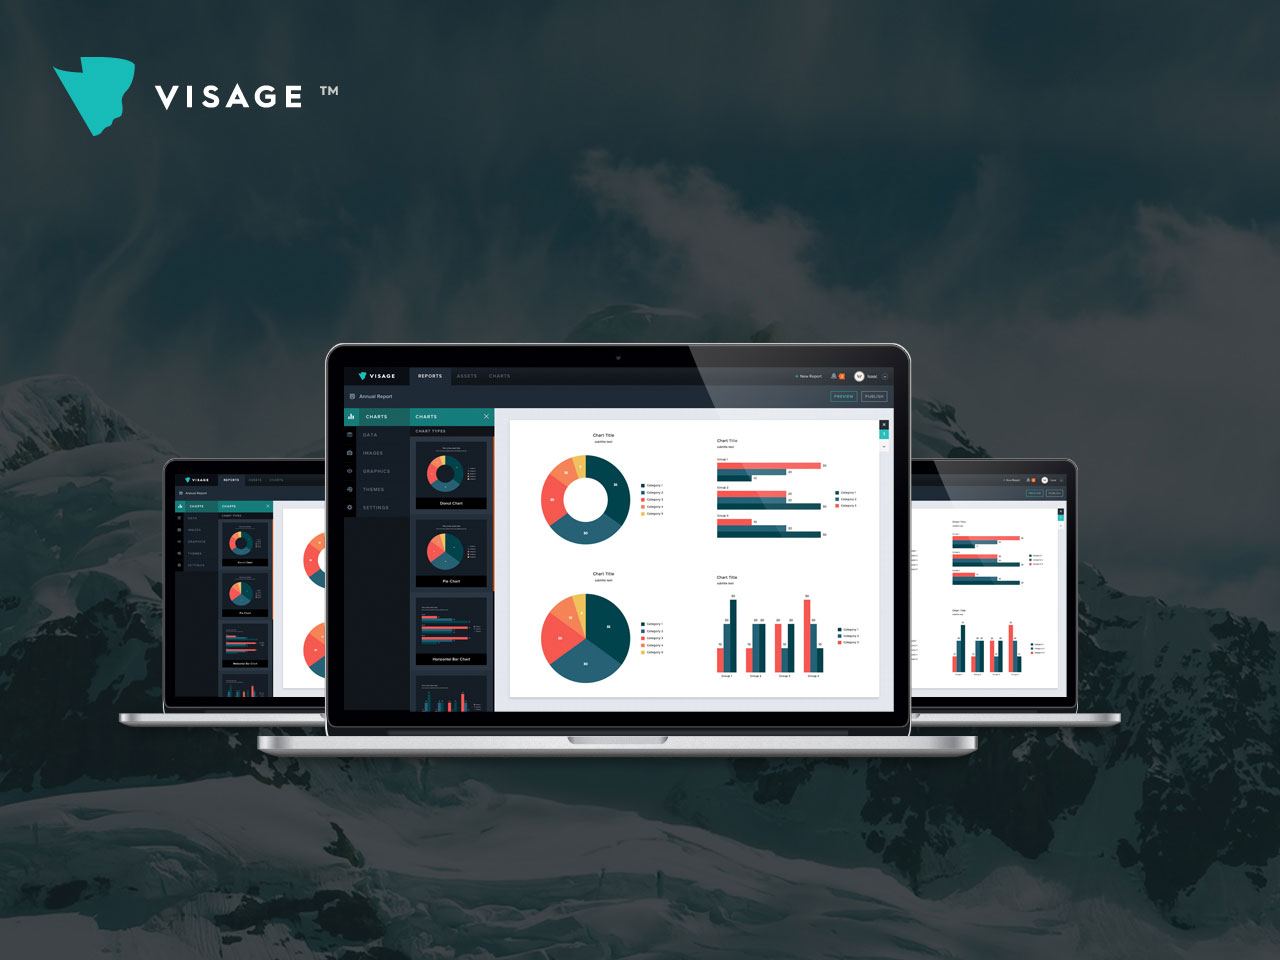
By failing to focus on design for any companies materials the end products lack clarity, lack brand consistency, and more importantly will affect the bottom line. And graphs are one of the most horribly applied items, from a design perspective, with marketing touch-points and general office usage within enterprises. This happens more than likely because the execution of well-designed and well-branded data visualization tools is difficult if not addressed acutely. Visage, a product from creative agency Column Five, is a new platform that enables non-designers to easily create beautiful, on-brand visual content such as data visualization, reports, presentations and infographics in a single web interface.
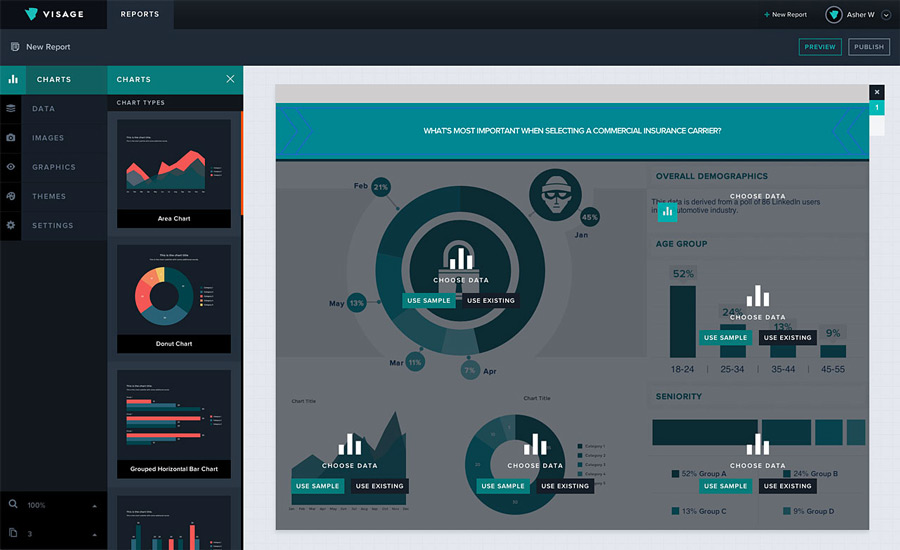
Easy, customized, themed, friendly, and powerful: that’s how we describe Visage. Using the platform everyone becomes powerful enough in a company to create data visualization solutions to be proud of which can be dropped into blog posts, social marketing efforts, reports and everywhere else with brand consistency.
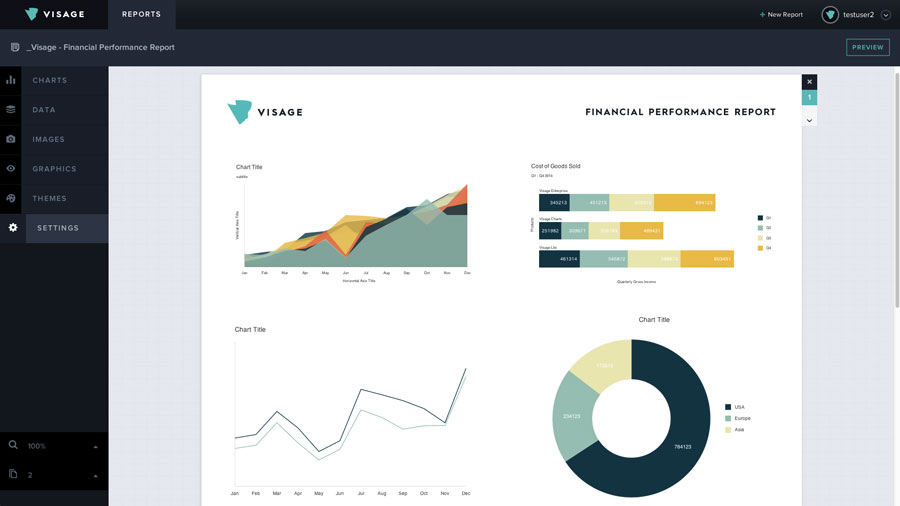
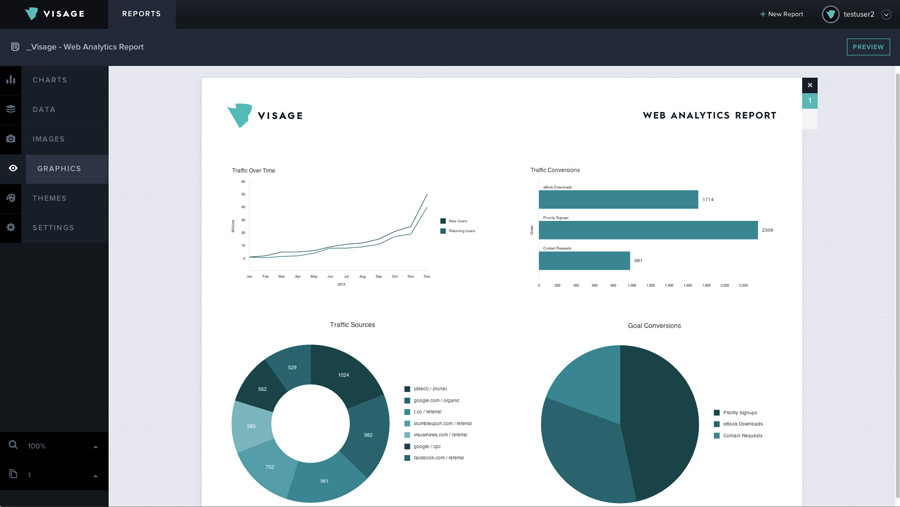
Brand consistency fused with improved workflow to build assets to make using charts in everything you want to use in your enterprise simpler and easier, the deliverable that will positively affect the bottom line is how impactful Visage can be. From bar charts, circle graphs, line details or custom template graphs the team behind Visage has re-configured how we deal with info-graphics in enterprises.
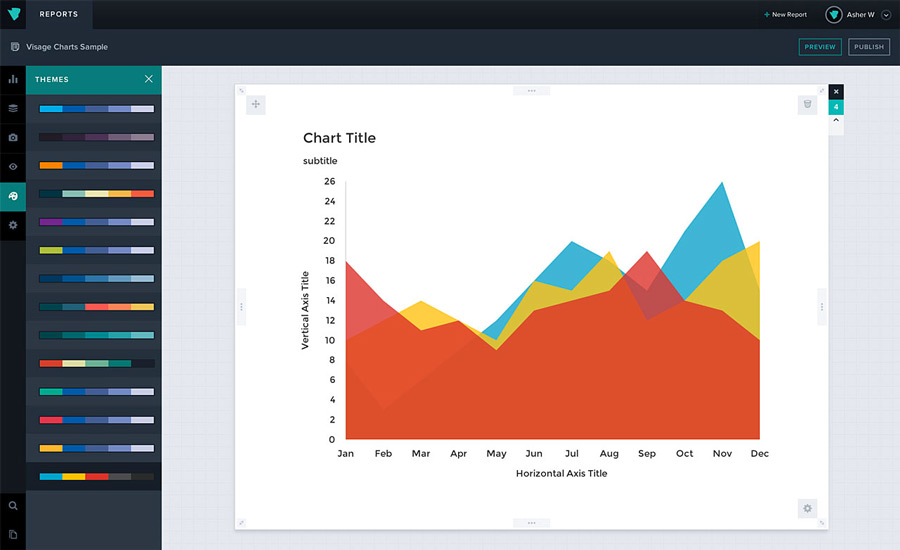
Launching Visage takes us to a space that is similar in look to Illustrator. Now that thought might be daunting to non-designers, but Visage does an incredible job to make what a designer is used to in the vector-based Adobe software much more easier to use as a web-app.
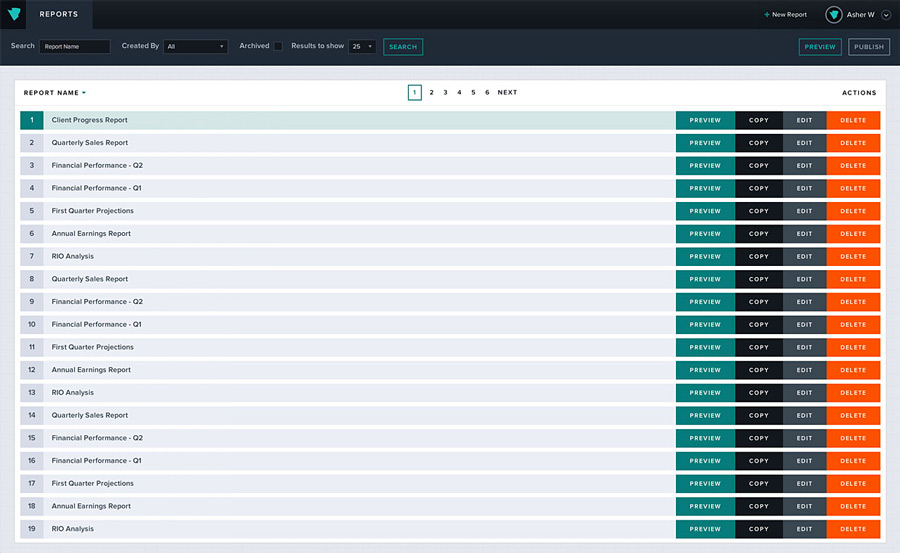
You start by selecting a square on a grid to create a content card. Content for each card is added by viewing a tool bar on the left to drag and drop a chart and input the charts corresponding data via pasting it through excel or uploading a CSV file. Charts can then be resized and moved. Other chart types can then be added to create a custom report as if in any other design software, but this time with tools focused on making creating branded charts easily. After a page of charts has been created or a template selected with needed data inserted, users simply attach a theme palette to the design to ensure brand consistency. That’s all there is to it, no layer configurations, no vector point manipulations or fumbling with brand color books for color harmony, Visage takes Excel data and helps anyone build data visualization pieces to be proud of and share worthy.
The team at Visage shared how useful their platform can be for large enterprises. An enterprise organization was distributing excel reports to their advertising clients every month via Excel. The reports were useful but hardly beautiful. The initial solution was to connect with Column Five and design a PDF to send out to clients, but the solution would be designed in a way that other staff members wouldn’t be able to edit the data unless they were efficient with Illustrator. With Visage these obstacles get turned into vapor. Data by anyone can be inputted quickly as if working on excel and brand themes can be selected to spit out charts that are not only useful but beautiful. The platform allows clients to automate and distribute beautiful reports to clients without ever having to open up Illustrator or connect with a design agency to make it happen.
Our attention span today is 8 seconds or less. If we’re not visually stimulated right away we move on. Using visualization to synthesize ideas is not only an effective medium; it’s the type of communication our brains crave. Enterprises for years have took on expenses to make this possible for their customers and clients, but with Visage everyone on a team becomes capable while minimizing expense costs for the creation of stimulating visual content.